sobolIndices
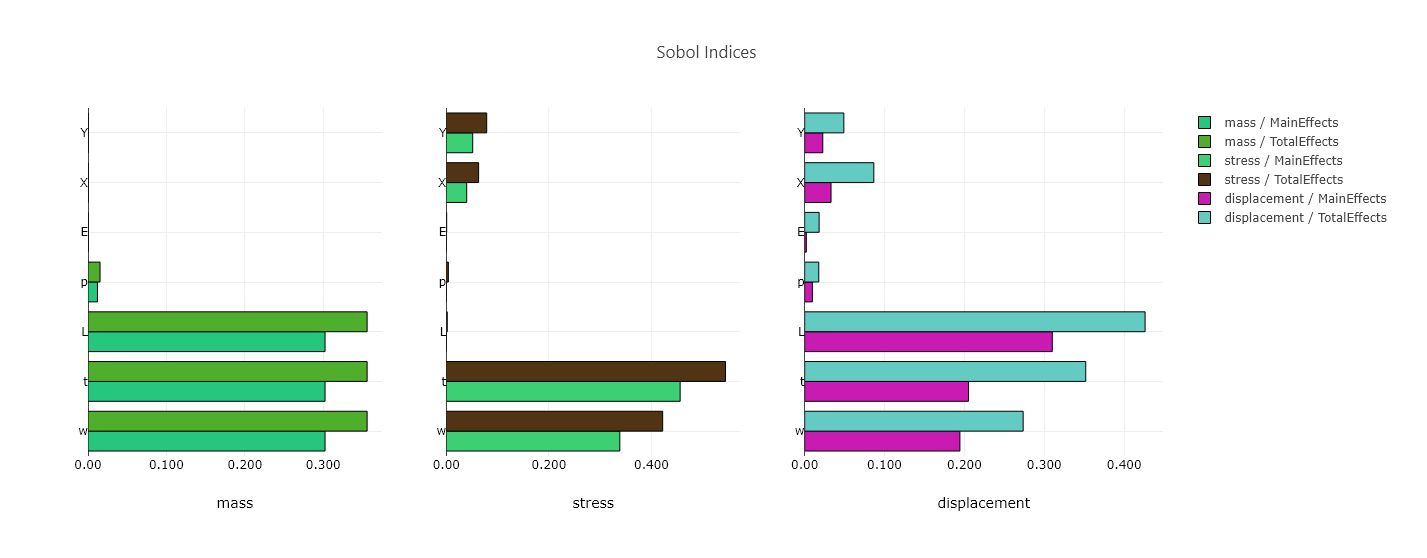
Fig. 137 Example Sobol’ indices chart
Description
Using Chartreuse, this node allows you to create a plot of Dakota-generated Sobol indices.
Notes
This node is specifically tailored to pull data from Dakota-generated HDF files. It will not work with other types of Dakota output files, nor will it work with arbitrary HDF databases.
In addition, only the sampling, polynomial_chaos, and stoch_collocation methods are compatible with this node.
Properties
method: The method from the Dakota study that is parent to the data for the Sobol indices. You can either provide the ID of the method from the original Dakota input file, or the HDF5 database path to a specific method group. If the Dakota study only contained one method, then this field can be left blank.
plotMainEffects: If true, Sobol main effects will be plotted.
plotTotalEffects: If true, Sobol total effects will be plotted.
canvasPerEffectsType: Split main effects and total effects onto separate canvases.
canvasPerResponse: Create a canvas for each response.
sort: Sort the bars of the bar charts by absolute value magnitude (i.e. a tornado plot).
Input Ports
hdfFile: the Dakota-generated HDF input file.
Output Ports
plotFileDataOut: A complete, serialized version of the plot that can be written out to a file for later viewing. Use a file node to save your plot to a file.