hdfTraceContour
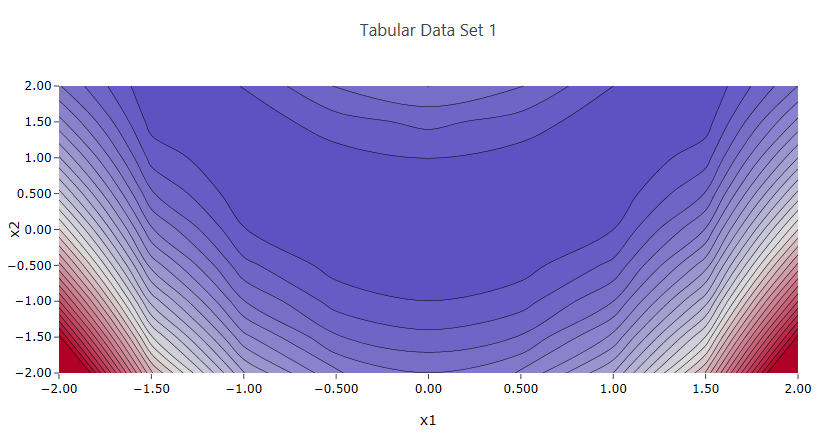
Fig. 129 Example contour plot
Description
Using Chartreuse, this node allows you to create a contour plot of a dataset from a Dakota-generated HDF5 file.
Notes
This node is specifically tailored to pull data from Dakota-generated HDF files. It will not work with other types of Dakota output files, nor will it work with arbitrary HDF databases.
Dakota HDF Properties
model - The model from the Dakota study that is parent to the variables and responses of interest. You can either provide the ID of the model from the original Dakota input file, or the HDF5 database path to a specific model group. If the Dakota study only contained one model, then this field can be left blank.
xLabel - The variable or response label to use for the X data of the contour plot.
yLabel - The variable or response label to use for the Y data of the contour plot.
zLabel - The variable or response label to use for the Z data of the contour plot.
Chartreuse Properties
Trace Name: The name of the trace. If this node is the final destination on the way to displaying the plot, this field will be used as the plot’s title that displays across the top. Otherwise, this field can be used to identify the trace among several traces (for instance, by using the legend provided with the plotWindow node).
Contour Lower Edge: The lower bound on the Z-axis where data for contours should be considered.
Contour Upper Edge: The upper bound on the Z-axis where data for contours should be considered.
Contour Division Range: The range on the Z-axis used to determine how frequently contour lines should be drawn.
Contour Coloring Style: There are different modes available for coloring contour plots.
Fill: Coloring is done evenly between each contour level.
Heatmap: A heatmap gradient coloring is applied between each contour level.
Lines: Coloring is done only on the contour lines.
None: No coloring is applied on this trace.
Color Scale Settings: The Color Scale settings group allows you to create ranges of colors across your plot. Refer to the main Color Scale documentation for more information.
Show Color Scale Legend: Display a bar next to your plot that indicates color scale ranges.
Input Ports
hdfFile - the Dakota-generated HDF input file.
Output Ports
plotFileDataOut - A complete, serialized version of the plot that can be written out to a file for later viewing. Use a file node to save your plot to a file.