scatterPlotMatrix
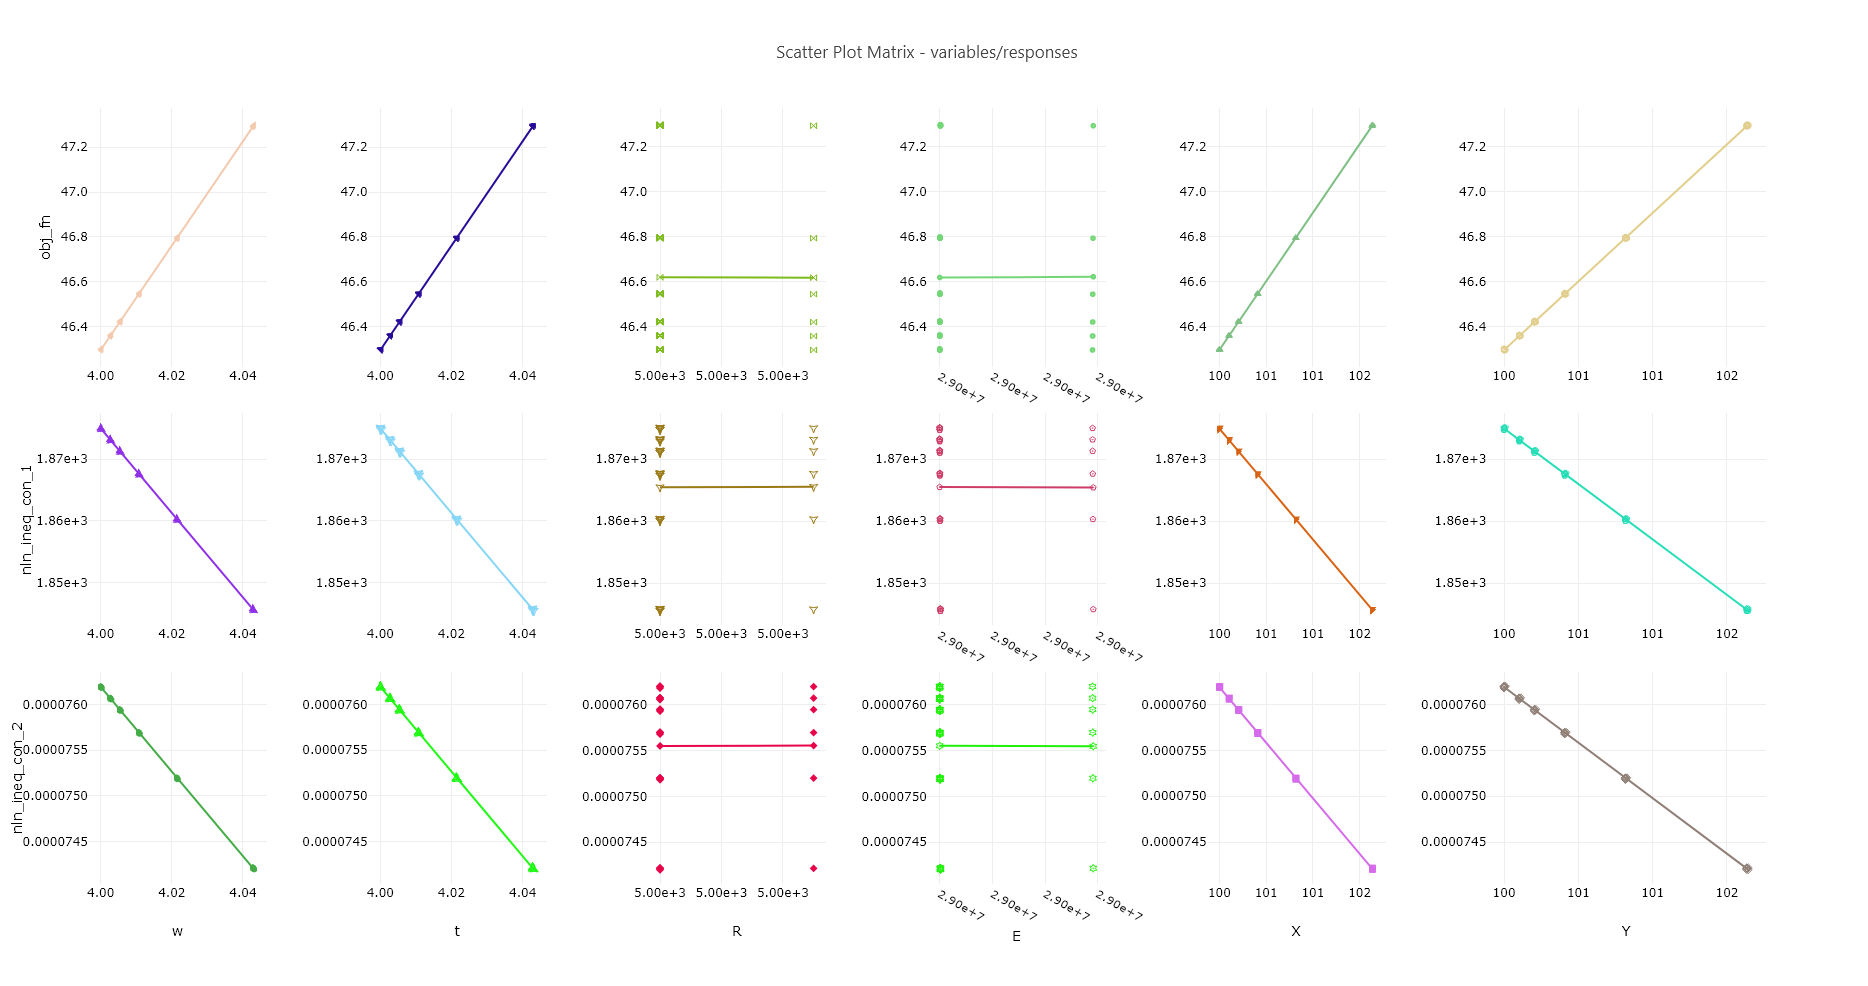
Fig. 136 Example scatter plot matrix
Description
Using Chartreuse, this node creates a matrix of canvases, each containing one scatter plot trace. Each canvas can display the scatter plot of variable vs. response, variable vs. variable, or response vs. response, depending on how the node is configured.
Notes
For large quantities of variables or responses (i.e. more than 10), it is recommended that you instead use the scatterPlotSuite node, which allows you to sub-divide your scatter plot matrix into more manageable grids.
This node is specifically tailored to pull data from Dakota-generated HDF files. It will not work with other types of Dakota output files, nor will it work with arbitrary HDF databases.
Properties
model - The model from the Dakota study that is parent to the data for the scatter plot matrices. You can either provide the ID of the model from the original Dakota input file, or the HDF5 database path to a specific model group. If the Dakota study only contained one model, then this field can be left blank.
drawLinearRegression - Draw a linear regression line on each generated canvas.
mirrorAllData - If false, then variables are plotted along the horizontal axis and responses are plotted along the vertical axis. If true, then both variables and responses are plotted along both axes.
blankDiagonal - Do not put data along the diagonal, where a variable or response will be mapped against itself.
drawLowerHalfOnly - Do not put mirrored data on the upper triangle of the grid of canvases.
outerAxisTextOnly - Do not repeat axis text for canvases that are “inside” the grid. If unchecked, this will lead to redundant canvas labels throughout your final plot.
ignoreUnchangingData - If checked, axes containing data that is not changing along either the X axis or the Y axis will be omitted.
Input Ports
hdfFile: the Dakota-generated HDF input file.
Output Ports
plotFileDataOut: A complete, serialized version of the plot that can be written out to a file for later viewing. Use a file node to save your plot to a file.