traceSurfacePlot3d
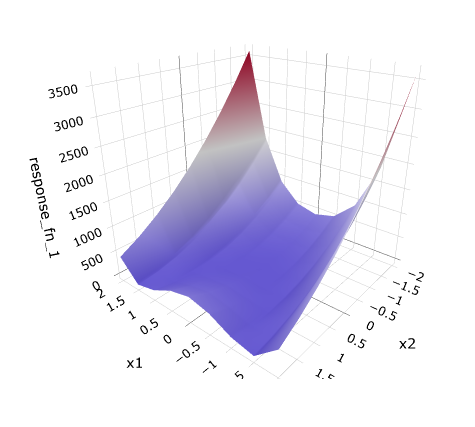
Fig. 126 Example 3D surface plot
Description
Creates a 3D surface plot from a three-dimensional dataset.
Properties
Trace Name: The name of the trace. If this node is the final destination on the way to displaying the plot, this field will be used as the plot’s title that displays across the top. Otherwise, this field can be used to identify the trace among several traces (for instance, by using the legend provided with the plotWindow node).
Color Scale Settings: The Color Scale settings group allows you to create ranges of colors across your plot. Refer to the main Color Scale documentation for more information.
Show Color Scale Legend: Display a bar next to your plot that indicates color scale ranges.
Input Ports
X: Data for the X axis.
Y: Data for the Y axis.
Z: Data for the Z axis.
Output Ports
trace: The data of the plot trace. Use this to forward the plot trace for further aggregation onto aplot canvas.
plotFileDataOut: A complete, serialized version of the plot that can be written out to a file for later viewing.Use a file node to save your plot to a file.