traceBoxPlot
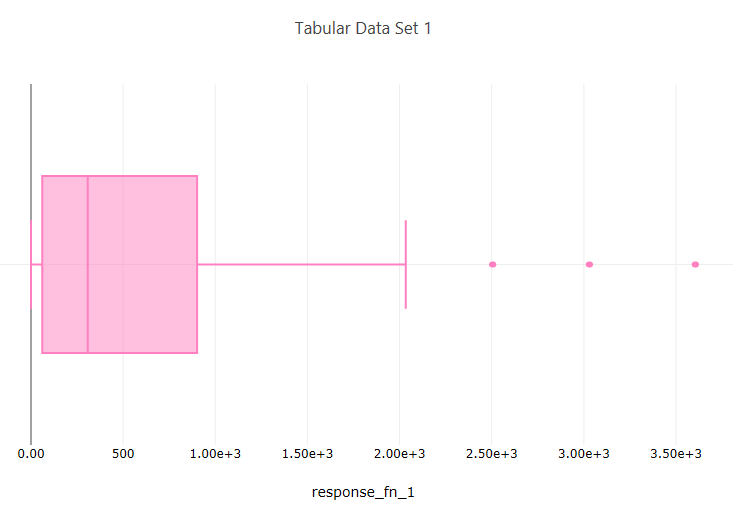
Fig. 120 Example box plot
Description
Creates a box-and-whiskers plot from a one-dimensional dataset.
Properties
Trace Name: The name of the trace. If this node is the final destination on the way to displaying the plot, this field will be used as the plot’s title that displays across the top. Otherwise, this field can be used to identify the trace among several traces (for instance, by using the legend provided with the plotWindow node).
Orientation: You can choose a horizontal or vertical orientation for the box-and-whiskers plot.
Trace Color: You can choose a fill color for the boxes in the box-and-whiskers plot.
Input Ports
data: The one-dimensional dataset to use for the box-and-whiskers plot.
Output Ports
trace: The data of the plot trace. Use this to forward the plot trace for further aggregation onto aplot canvas.
plotFileDataOut: A complete, serialized version of the plot that can be written out to a file for later viewing. Use a file node to save your plot to a file.