Legacy Graphics Output
Warning
This section describes Dakota’s legacy Unix / X Windows-based graphics capabilities. Historically, this capability could help Dakota users view results in graphical plots. However, this legacy capability has been completely replaced by functionality provided in the Dakota graphical user interface (GUI).
The X Windows graphics option is invoked by including the graphics
flag in the environment specification of the input file (see Listing 25).
The graphics display the values of each response function (e.g., objective and constraint
functions) and each parameter for the function evaluations in the study.
As with tabular output, internal finite difference
evaluations are suppressed in order to omit this clutter from the
graphics. Fig. 33 shows the optimization
iteration history for the container example.
If Dakota is executed on a remote machine, the DISPLAY variable in the user’s UNIX environment [Gil92] may need to be set to the local machine in order to display the graphics window.

Fig. 33 Dakota 2D graphics for “container” problem showing history of an objective function, an equality constraint, and two variables.
The scroll bars which are located on each graph below and to the right
of each plot may be operated by dragging on the bars or pressing the
arrows, both of which result in expansion/contraction of the axis scale.
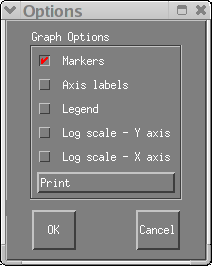
Clicking on the “Options” button results in the window shown in
Fig. 34, which allows the user to include
min/max markers on the vertical axis, vertical and horizontal axis
labels, and a plot legend within the corresponding graphics plot. In
addition, the values of either or both axes may be plotted using a
logarithmic scale (so long as all plot values are greater than zero) and
an encapsulated postscript (EPS) file, named dakota_graphic_i.eps
where i is the plot window number, can be created using the “Print”
button.

Fig. 34 Options for Dakota 2D graphics.

