categoricalScatterPlots
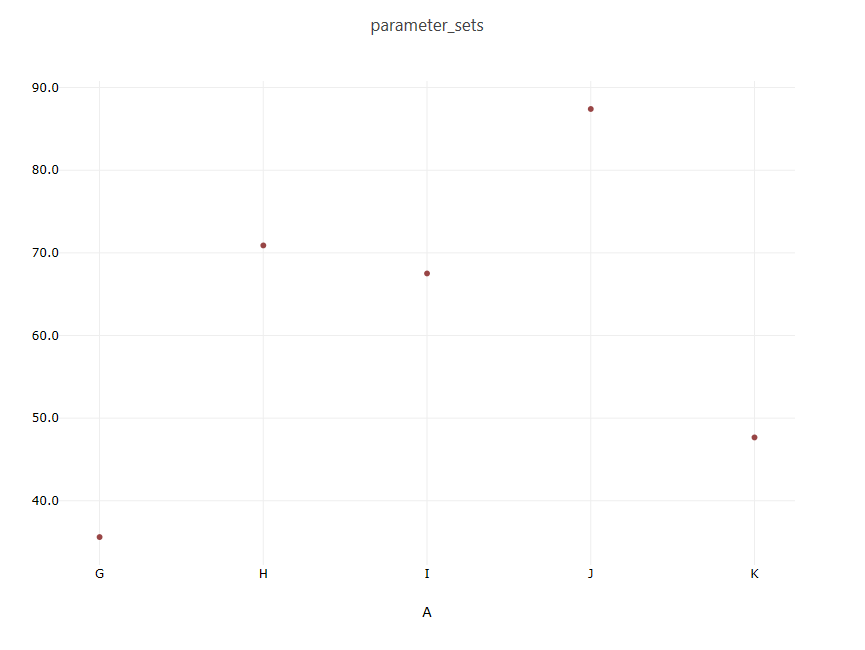
Fig. 140 Example categorical scatter plot
Description
Given a Dakota-generated HDF5 file containing one or more discrete state sets, this node allows you to use Chartreuse to plot that discrete state set data as a set of scatter plots. One plot file will be created per discrete state variable.
Notes
This node is specifically tailored to pull data from Dakota-generated HDF files. It will not work with other types of Dakota output files, nor will it work with arbitrary HDF databases.
This node is solely responsible for writing the plot files to disk. It is not necessary to use file nodes in your workflow to save the plots.
After generating and saving the plot file(s), you are free to further modify the plot using the “Chartreuse > Edit plot” context menu option.
Properties
method: The Dakota method ID used to locate the correct discrete state set variables. If the Dakota study only contained one method block, this field can be left blank.
xAxisLabel: Provide a custom label for the horizontal axis of your scatter plot.
yAxisLabel: Provide a custom label for the vertical axis of your scatter plot.
outputFilePrefix: Use this field to apply a common prefix to each generated plot file. This can help to prevent unintentional overwriting of plot data if the workflow is run multiple times.
Input Ports
hdfFile: the Dakota-generated HDF input file.
Output Ports
None.