variablePdfVisualizer
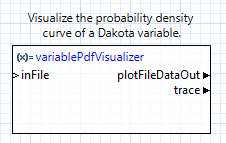
Fig. 137 PDF visualization node
Description
This node allows you to visualize the probability density function (PDF) associated withan uncertain variable from a Dakota study, using Chartreuse as the plotting library.
To use this node, simply provide the Dakota input file as a “file” node on the canvas, and pipe its “fileReference” output port to the “inFile” input port of this node. In addition, provide the descriptor of the variable you want to visualize in this node’s Settings Editor.
Note that this node has the familiar “plotFileDataOut” and “trace” output ports seen on other Chartreuse nodes. This means that Dakota variable PDF curve plots can be combined with other types of Chartreuse plotting nodes (for example, aggregating traces onto the same canvas).
Properties
variable: The descriptor of the variable to visualize.
Input Ports
inFile: the Dakota input file.
Output Ports
trace: The data of the plot trace. Use this to forward the plot trace for further aggregation onto a plot canvas.
plotFileDataOut: A complete, serialized version of the plot that can be written out to a file for later viewing. Use a file node to save your plot to a file.